Section: 23 Boundless Analytics - Pre-discovery Tool
23.1 Introduction
In this section we demonstrate application of Boundless Analytics - the tool developed by Tomasz Imielinski and his team at Rutgers (and supported by NSF subcontract of Center of Science of Information at Purdue University). Boundless Analytics calculates all significant bar graphs from the data set and allows to find data subsets (slices) which deviate the most from the whole data set in regard to frequency distribution of an attribute. Boundless performs an otherwise very tedious task of looking at all combinations of attribute value pairs to identify the “significant ones” - saving enormous amounts of work in preliminary exploration of data.
We are using here the Minimarket data puzzle 14.8 describing customer transactions in the small chain of minimarkets in NJ. Data 101 students used Boundless Analytics to discover the most interesting subsets of this data set
23.4 The Boundless Analytics web application
Boundless Analytics Interface: http://209.97.156.178:8082/
(it is a soft login abc/abc will do)
Objective: Nominate the most interesting subset of the Minimarket2022 data set
Seems open ended, no? what is the “most interesting”?
Chi-square value is a good measure. We explain it below.
By swiping through possible plots (using Next), one can identify good candidates for the “interesting data subsets”)
These are plots where red and blue bars differ the most. In other words we want to reject the null hypothesis of independence of red and blue distributions over the data slice and the complement of the data slice. The higher the chi-square is, the strongest is our rejection of independence of red and blue distributions.
Therefore this task can be seen as chi-square hunt for the highest chi-square value (use the snippet 17.1 code after plugging in definition of a slice and the anchor attribute)
23.5 Chi square hunt
ATTACHED - the data set (same as on the Boundless Analytics interface) HomeworkMarket2022-2.csv
RESULTS:
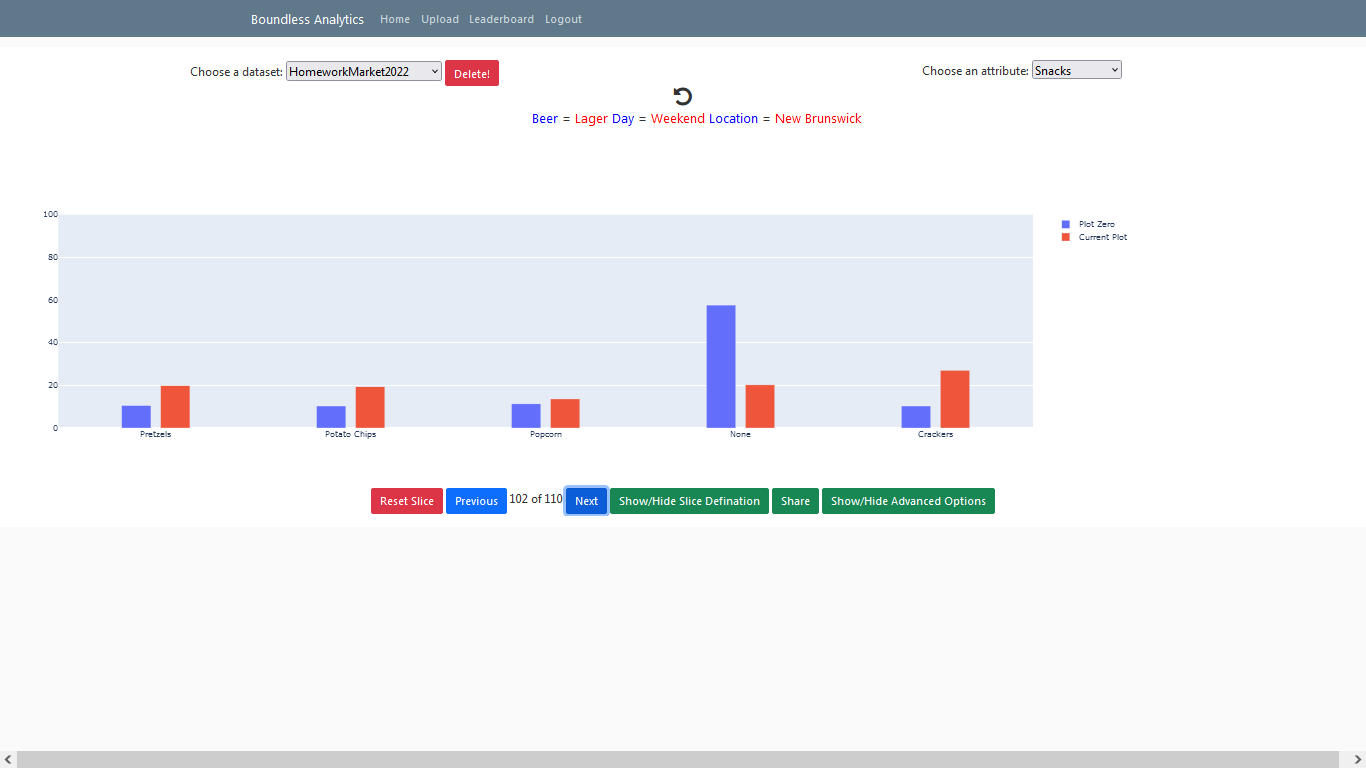
Here are two out of 250+ submissions. The one with the highest chi-square of 600.15 is the slice showing weekend buyers of lager in New brunswick but disproportionately more snacks (in particular Crackers). This was identified by nearly 20 students.
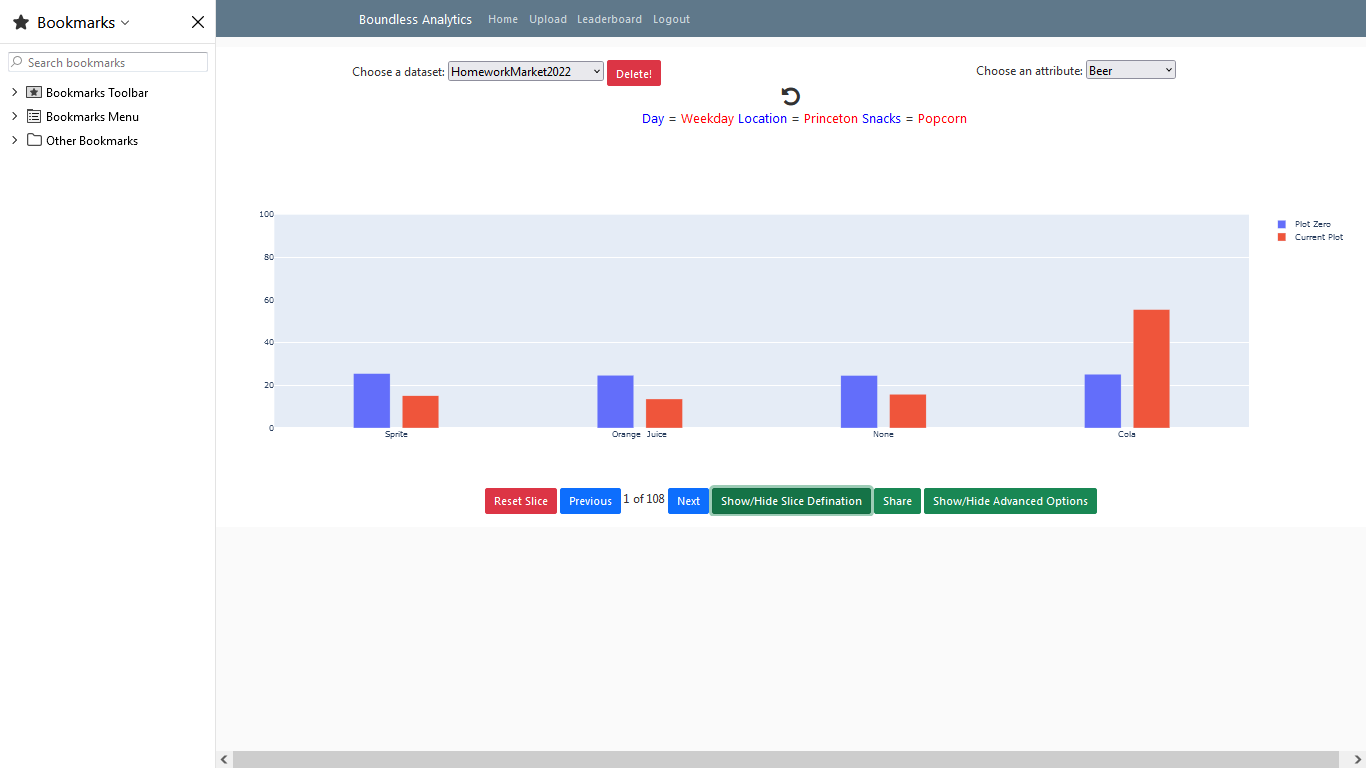
Here is another find by Eva Zhang showing disproportionately frequent sales of Coca Cola on Weekdays in Princeton for transactions which purchased Popcorn. The chi-square value of this find is 205.31, with df=3.