Section: 5 Data science vs Databases
At the beginning there is always data. In R, it is a data frame which is a set of rows and columns. Our Moody data set is an example of a data set. It contains thousands of rows and a handful of columns.
But is it a complete data set or is it just “tip of an iceberg”? Is our dataset “all there is”? Or is it just a sample from a possibly much larger, unknown, universe?
Data science and statistics deal with situations when data is partial. In other words we do not have the whole data set. We only have a sample, even if this sample is very large. No matter how large the data is, it is still just a sample from a larger hypothetical data set that may involve future, unknown yet, data values.
On the other hand ,in the field of databases we believe that our data set is complete. Data is “as presented”. We query such data and treat the answers as exact values, since we fundamentally trust that the data we have is correct and complete. This is quite different from the data science approach which always treats data as an incomplete sample of the unknown, real, data set. Thus, data science deals with approximations.
We formulate the main principle behind data science
Data is always a sample
Example: Airbnb data set.
Let airbnb be the data set describing Airbnb rentals in New York City. It has 5287 tuples and is a set of listings with room type, neighborhood, neighborhood group (more specific names of hundreds of NYC neighborhoods such as Tribeca, East Village, Park Slope etc), floor and price.
| id | name | host_name | neighbourhood_group | neighbourhood | room_type | floor | price |
|---|---|---|---|---|---|---|---|
| 5756241 | 1 bedroom in a 2 bedroom apartment | Teri | Manhattan | Midtown | Entire home/apt | 16 | 531.3010 |
| 5692807 | Charming Two Bedroom in Chelsea 30 days+ | Eric | Manhattan | Chelsea | Entire home/apt | 1 | 287.3102 |
| 6286253 | SunLit Room in Hip Neighborhood | Rebekah | Brooklyn | Bushwick | Private room | 1 | 267.7120 |
| 594732 | Greenwich Village Skylit 1BR +deck! | Chris | Manhattan | Greenwich Village | Entire home/apt | 16 | 537.4393 |
| 35199464 | Penthouse on the beach 3 floors of art, fun,surf, | Sata | Queens | Far Rockaway | Entire home/apt | 5 | 152.7281 |
There are two approaches of treating this data set:
Approach 1: airbnb data set is complete. We just treat it as “as is”. We can run queries against Airbnb data sets and return definite query answers. For example we can ask about the fraction of Airbnb rental offerings which are located in Brooklyn (it is around 42.1%). Or the average price of Brooklyn rental? It is $179.06. Answers to our queries are exact.
Approach 2: airbnb data set is incomplete. It is just a sample of much larger, unknown set of all prices of airbnb rentals ever (even though we do not have timestamps associated with rentals stored in the Airbnb table) If this is the case, answers to queries are no longer definite and deterministic but rather estimators of real values which are unknown to us.
Let us examine these same queries: query Q1 about frequency of Brooklyn Airbnb rentals and query Q2 about mean price of Brooklyn Airbnb rentals.
We begin by running this two queries against airbnb data, assuming it is complete data set. In other words we follow Approach 1. Thus, we treat the airbnb data set “as is” – and the answers to our queries are prices: 42.1% and $179.06 respectively.
5.1 Query 1: Fraction of Brooklyn Airbnb Rentals
The following query returns the required fraction of Brooklyn rentals
round(nrow(airbnb[airbnb$neighbourhood_group=='Brooklyn',])/nrow(airbnb),3)
calculates the fraction of Brooklyn Airbnb offerings – 42.1%.
5.1.1 Fraction of Brooklyn Airbnb rentals)
Now, let’s follow Approach 2 and not trust that the airbnb data set is complete, but rather a sample of some larger “complete” airbnb data set. Under normal circumstances we will never know this “real” data set. But here let us assume that we know about airbnbReal. It comprises 35,573 tuples. Our data set airbnb was the random sample of 5278 tuples out of the total of 35,573 of airbnbReal. Not surprisingly, the value of our query will now return a different value (42.4%) - making our original query answer just an estimate.
5.1.2 Fraction of Brooklyn Airbnb rentals in the real airbnb data set
The answer to our query - the real fraction of Brooklyn rentals differs now from 42.4%. It is close, but not the same. Thus, the fraction 42.4% obtained from the sample is only an estimate of the real fraction of Brooklyn apartments. The quality of this estimate depends on the size of our sample data set. In our case that sample size was 5278 tuples. The smaller the size of the sample, the less accurate the estimate is. Data is just a sample. This is the data science approach.
The following three histograms show distribution of frequency of Brooklyn apartments across 1000 samples of different sizes. We show three sample sizes here: samples of 1000 apartments each, 100 apartments each and finally 5000 apartments each taken from the airbnbReal data set. Notice how the spread of the frequency values depend on the sample size. The larger the data sample is, the “tighter” is the histogram. In the case of a sample size of 1000, we may obtain frequencies of Brooklyn offerings ranging from 38 to 46%.
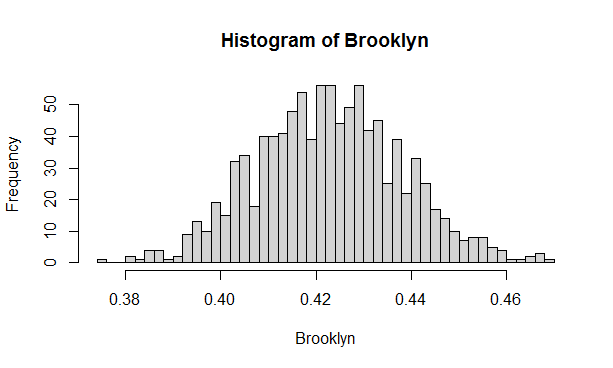
Figure 5.1: Distribution of the fraction of airbnb apartments which are located in Brooklyn - 1000 samples each of the size =1000
The Histogram below shows distribution of frequencies of Brooklyn Airbnb rentals if our database has only 100 offerings. Notice that now if we run 1000 such samples of size 100, the spread is much larger (it is determined by standard deviation) . Now we can get frequencies ranging from 30% to 55%!
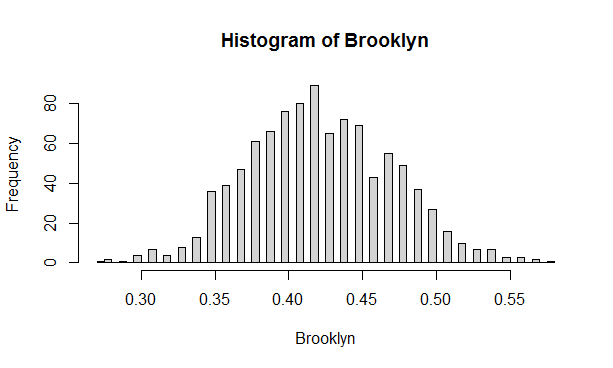
Figure 5.2: Distribution of the fraction of Brooklyn apartments - 1000 samples each of the size =100
Finally, the last of the three histograms shows spread of frequencies over 1000 samples each of size 5000. This time the spread is much smaller – and we range from 41 to 44% with some outliers of course. All these histograms illustrate a simple fact that if we believe our data set to be incomplete and just a sample of a larger data set, we can only answer queries with estimates. One of the key objectives of data science is to provide these estimates with some measure of confidence (see section 11)
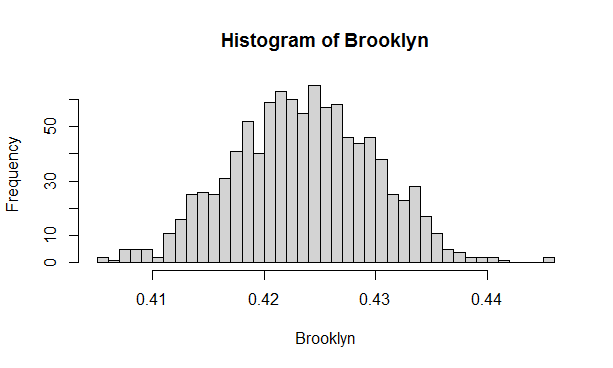
Figure 5.3: Distribution of the fraction of Brooklyn apartments - 1000 samples each of the size =5000
5.2 Query 2: Mean price of Brooklyn Airbnb rentals
The following query returns the mean price of Brooklyn rentals
round(mean(airbnb[airbnb$neighbourhood_group=='Brooklyn',]$price),2)
This returns $179.06
5.2.1 Mean price of Brooklyn airbnb rentals
Trusting airbnb it is a complete data set and following approach (1), we view $179.06 as precise and definite answer.
As in case of query 1, we also follow approach (2) and assume that in fact airbnb is nothing but a sample of 5287 tuples from the airbnbReal data set of It comprises 35,573 tuples. Our data set airbnb was the random sample of 5278 tuples out of the total of 35,573. Not surprisingly, the value of our query will now return a different value $179.84 making our originally returned mean price just an estimate. Thus, the mean price of $179.06 was only an estimate of the real mean price of $179.84.
5.2.2 Mean price of Brooklyn airbnb rentals in real Airbnb data set
In a similar way for Query 1, we present histograms of mean price of Brooklyn Airbnb offerings for 1000 samples of sizes 1000, 100 and 5000 respectively from airbnbReal data set of 35,573 tuples. Again we observe that the larger the sample, the tighter the histograms. For example, for samples of size 100, the mean price for a sample can range from $140s to $220s.
These histograms for mean price illustrate a very important concept in statistics called Central Limit Theorem. This remarkable theorem says that regardless of what the original distribution of data is, the distribution of means of samples follows normal distribution (the Bell curve), as illustrated in the histograms below.
Again, if we treat the airbnb data set we have only as a sample, we have to provide measures of the quality of estimates such data provides for any query. Only when we take data ‘as is’ can we talk about definite query answers. Otherwise, no matter how large our data set is, it is only a sample. This is probably the shortest summary of data science methodology. Nothing is exact. Everything is just a sample. As such, we need to do better than just mistrust the data – we should provide measures of quality of the estimates that are down from data as samples.
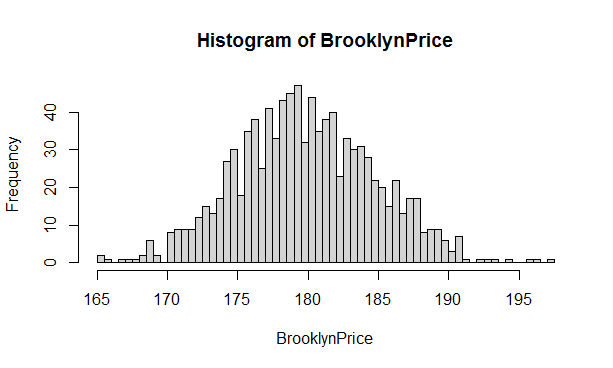
Figure 5.4: Distribution of mean Brooklyn airbnb rental price for 1000 samples each of size =1000
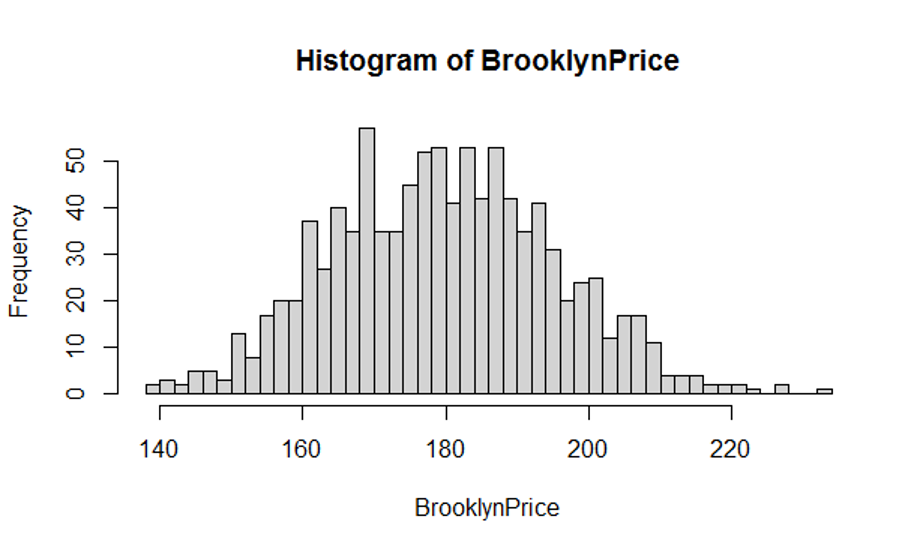
Figure 5.5: Distribution of mean Brooklyn airbnb rental price for 1000 samples each of size =100
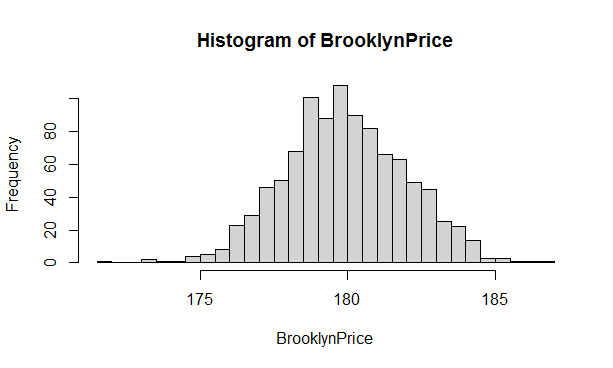
Figure 5.6: Distribution of mean Brooklyn airbnb rental price for 1000 samples each of size =5000
The following snippet (5.5) shows impact of different samples of airbnbReal data set on queries Q1 and Q2. You can change the size of a sample and run this code repetitively to see how the values returned by query 1 and query 2 change. Instead of obtaining this particular sample of 5287 of tuples from the aibnbReal we could have obtained a different random sample of 5287 tuples and get different estimators of frequency of Brooklyn rentals as well of the mean price. Change 5287 to any number (1000, 100,2000) and rerun the snippet 5.5
We can repeat similar histograms for any queries on the Airbnb data set such as
Q3: Mean prices of Tribeca apartments on floors higher than 5th floor
Q4: Fraction of high floor offerings in Manhattan (high floor >6)
Q5: Mean prices of private room apartments in Manhattan
Q6: Fraction of private rooms under $150 in Queens
Etc.
Each such query has an exact answer if we believe that data is complete and is only an estimate if we treat data as a sample.